Consulting | Excel Examples
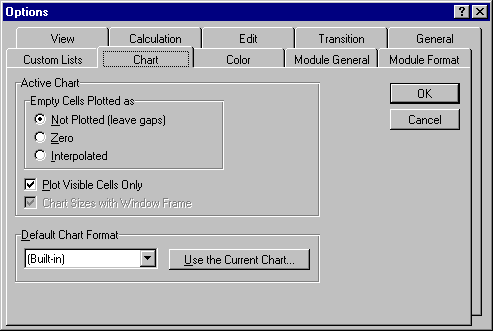
You can use menu choices Tools, Options and set the Empty cells plotted as values as shown below.
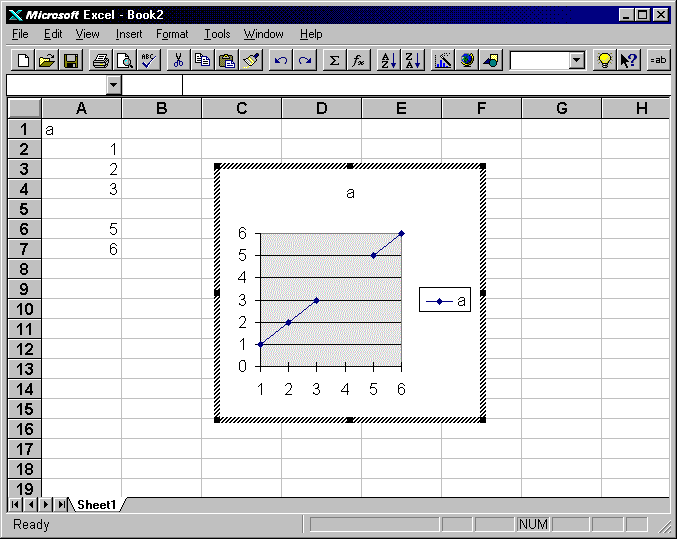
When you choose Empty cells plotted as Not Plotted (leave gaps), you chart appears as: